Boat Valuation Model - Swiss Secondhand Market
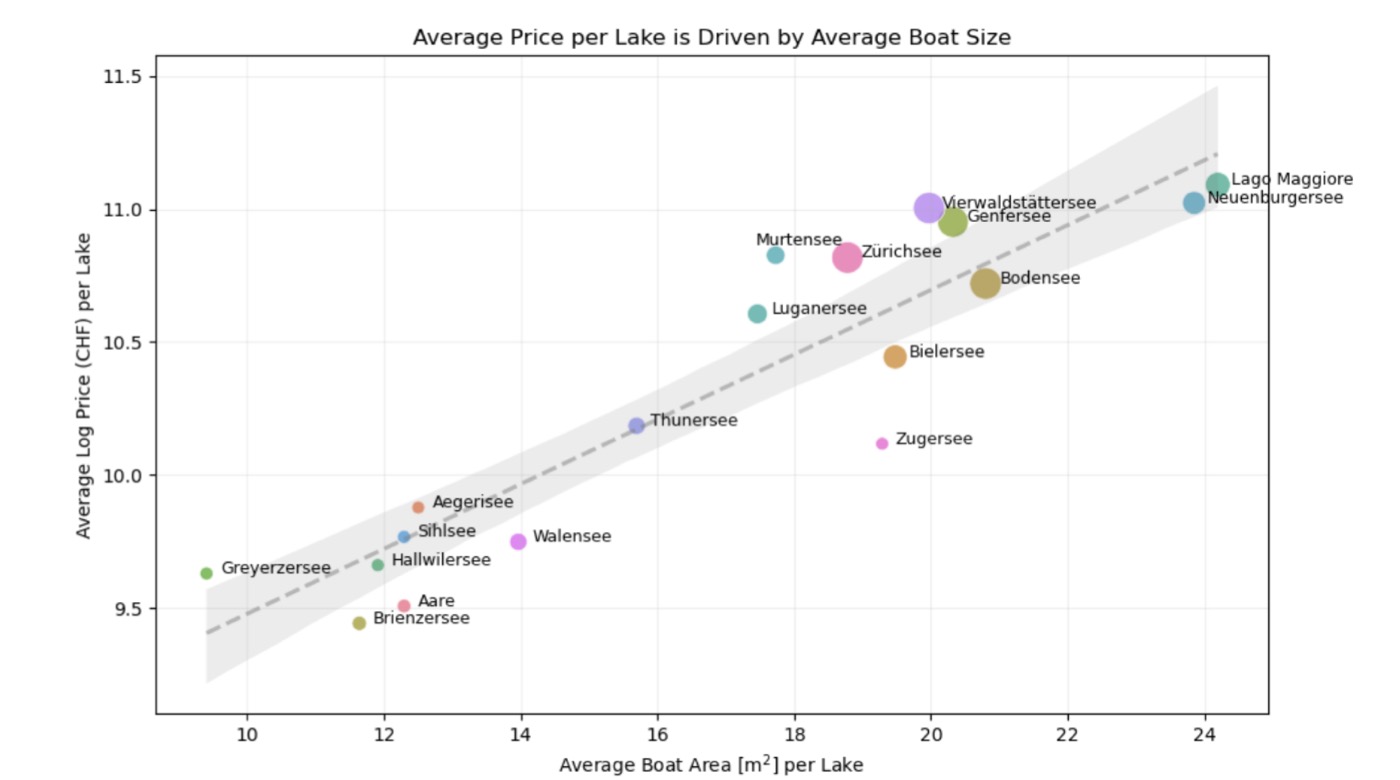
Key finding: price differences across Swiss lakes are explained by boat size, not location itself
Course project at HSLU with Marcel Amrein and Fadri Campell.
Overview
While the automotive market has mature tools like AutoScout24 for price estimation, the secondhand boat market lacks equivalent support. Boat owners rely on guesswork, dealer opinions, or manual listing comparisons — methods that are time-consuming and imprecise.
This project addresses that gap by scraping motorboat listings from boot24.ch (a Swiss marketplace for new and used boats) and developing a hedonic pricing model — a model that estimates price as a function of a boat’s individual attributes (size, power, age, condition) rather than simple market comparables. The goal: determine which features drive price, whether location matters, and how accurately listing data alone can predict market value.
Data Pipeline
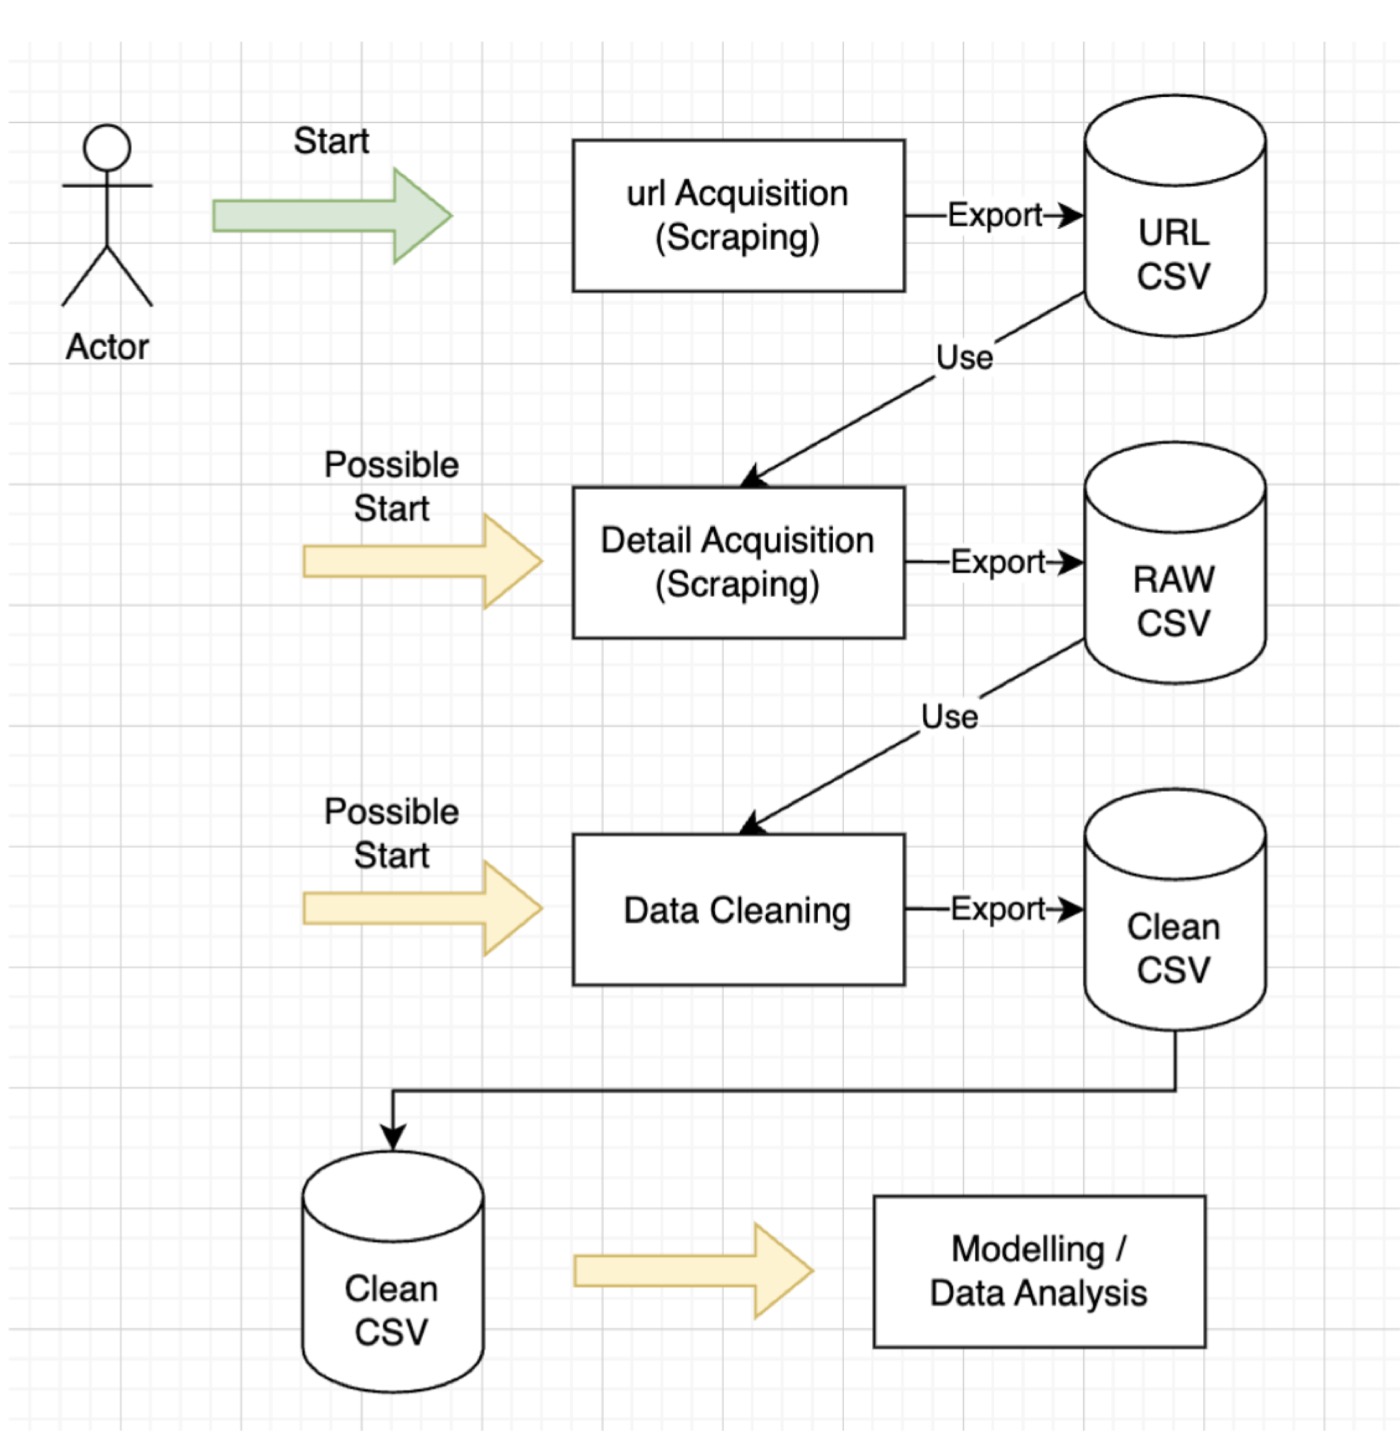
Two-phase scraping pipeline: URL collection, detail extraction, cleaning, modeling
- URL Acquisition — Collected 3,166 unique listing URLs in a single session (April 4, 2025). boot24.ch reorders listings between page loads, so we split scraping into two phases: first collect all URLs into a deduplicated set, then extract details — preventing duplicates and missed entries
- Detail Extraction — Iterated over saved URLs to extract structured specifications and equipment data (460+ unique equipment types per listing)
- Data Cleaning — Custom Python class translating German column names to English, parsing composite fields (“100 PS / 20 kW” → separate columns, “CHF 12’000.-” → numeric, “7.5 m x 2.5 m” → length + width), standardizing lake/location names via mapping dictionaries
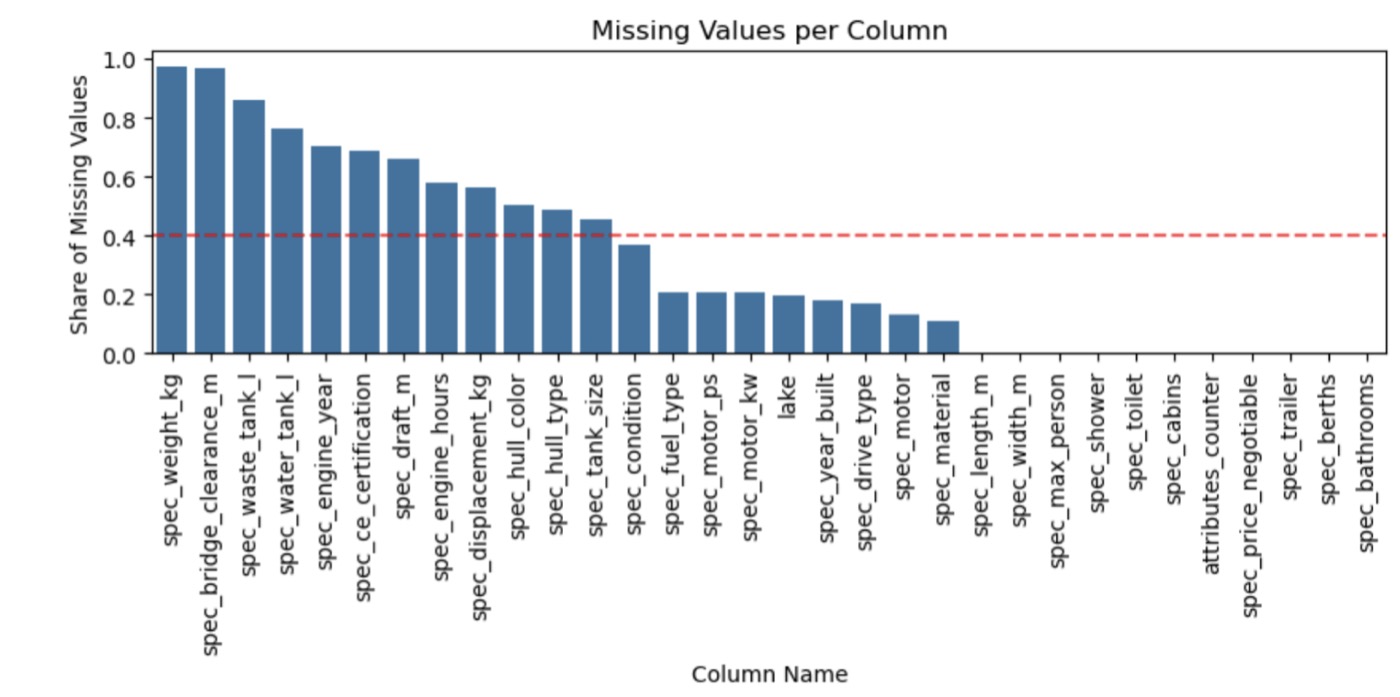
Feature selection: retained columns with less than 40% missing values (red threshold line)
- Feature Selection — Applied a 40% missing-value threshold, then dropped remaining incomplete listings to avoid imputation bias. This reduced the dataset from 3,166 to 909 complete listings — a significant reduction that likely skews toward dealer listings and mid-to-high-end boats, since private sellers tend to fill in fewer fields
- Modeling — OLS regression on log-transformed prices (to handle the skewed distribution from CHF 1,700 to 850,000), validated with 20-fold cross-validation
Results
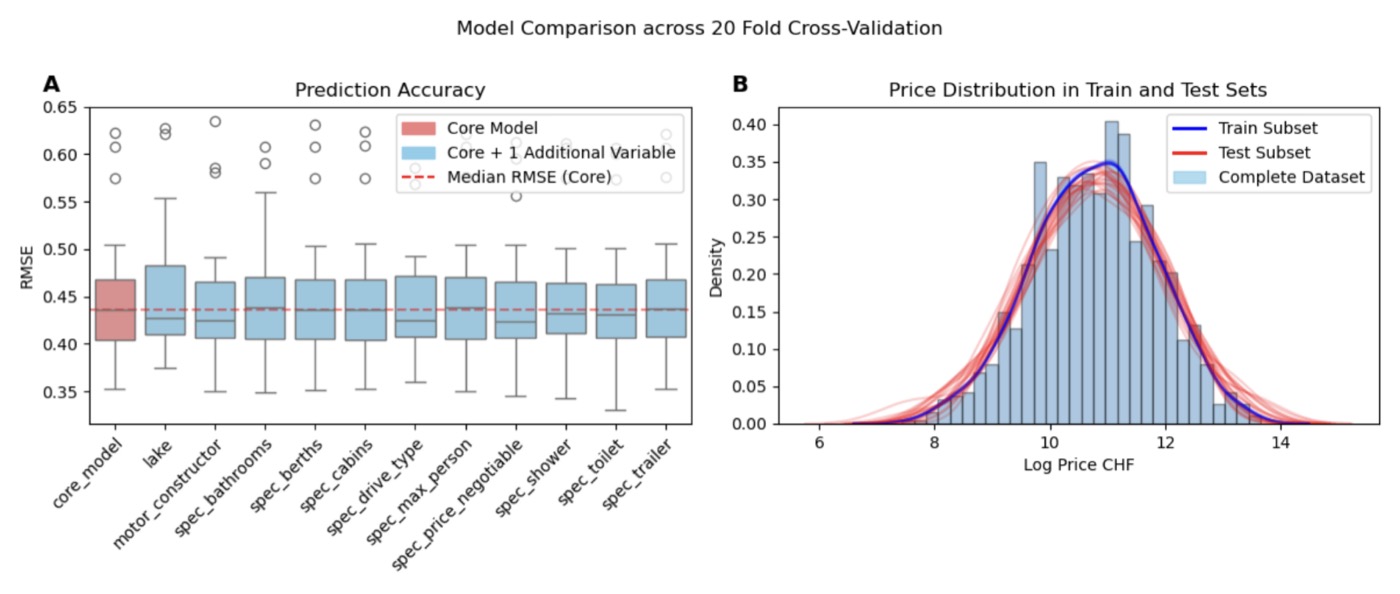
Cross-validation: core model vs. adding one variable at a time
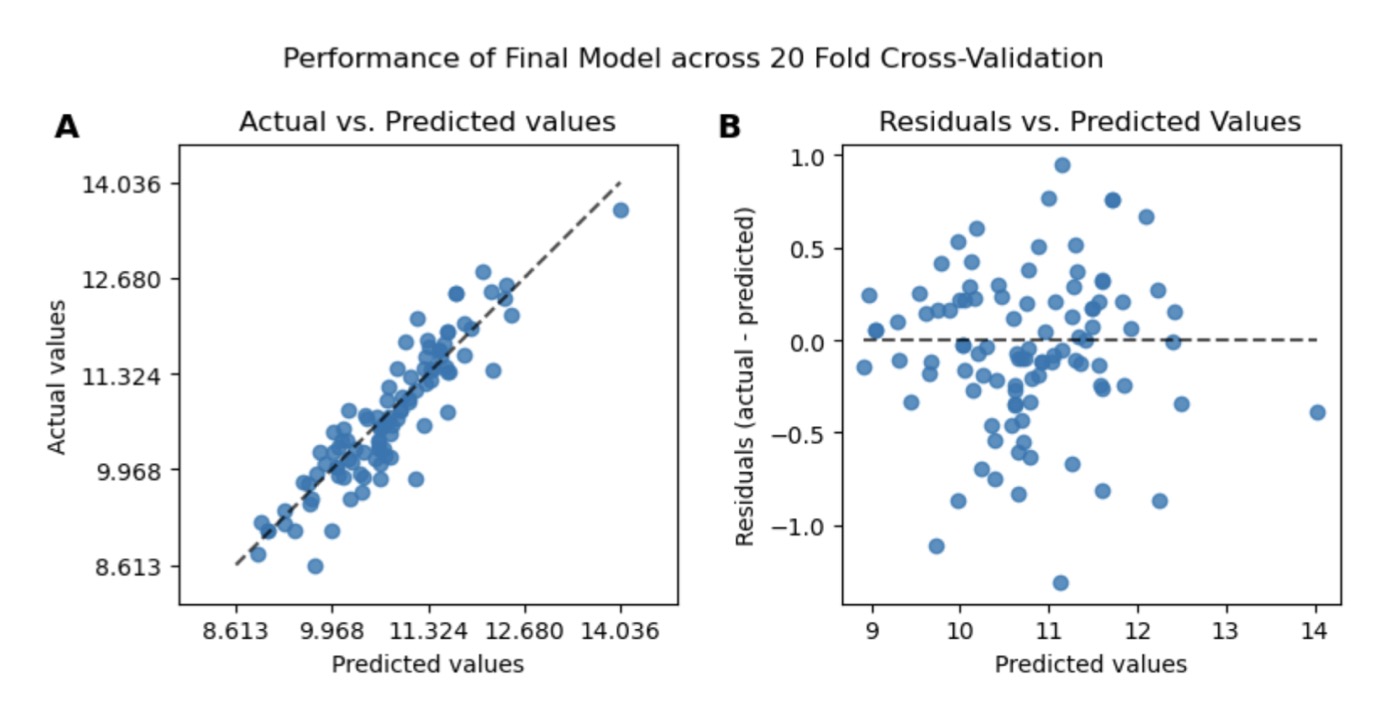
Final model: actual vs. predicted (left), residuals (right)
Statistically significant predictors (p < 0.05): construction year, motor power, boat size, equipment count, condition, material, and fuel type.
Core model RMSE: ~0.45 on log-prices (20-fold cross-validation). Adding individual non-significant variables produced marginal improvements — the gains from maximizing feature count were small compared to focusing on the most predictive, easily obtainable attributes.
Location finding: Average prices differ across Swiss lakes, but this variation is largely explained by boat size — larger lakes accommodate bigger boats. Location itself has no statistically significant isolated effect on price. However, it still improved cross-validation RMSE, making it a pragmatic inclusion.
Model limitations: Prediction accuracy is highest in the mid-price range (CHF 20K–200K) where the dataset is densest. At the extremes, a single model struggles — a 10% error on log-price translates to very different CHF amounts for a CHF 5K dinghy vs. a CHF 500K yacht. For production use, segmenting by price range and training separate models per segment is a promising direction to explore.
My Contribution
I designed and built the scraping and data cleaning pipeline together with a colleague: the two-phase URL/detail acquisition approach to handle dynamic pagination, the custom Python cleaning class with German-to-English column mapping and composite field parsing, and the solution for the sparse equipment data challenge — collapsing 460+ equipment types into a single count variable after finding that individual flags had too few positive values to be statistically meaningful.
What I Learned
The hardest part of this project was not the model — it was getting clean data. With 460+ equipment types but most boats listing only 3–5, the raw feature space was almost entirely sparse. We had to radically simplify our representation, which taught me that practical data science is mostly about making pragmatic decisions with imperfect data rather than choosing the fanciest algorithm.
I also learned to be more critical about survivorship bias in data cleaning. Our 40% missing-value threshold and complete-case analysis dropped 71% of listings. In retrospect, the remaining 909 listings likely overrepresent well-documented dealer boats and underrepresent private budget listings — which partially explains why the model performs worse at the low end of the price range.
Technology Stack
- Scraping: Python, BeautifulSoup, requests
- Data Processing: pandas, NumPy, custom cleaning classes
- Modeling: statsmodels (OLS), scikit-learn (cross-validation)
- Visualization: matplotlib, seaborn