FacADe - City-Wide Facade Advertising Visibility
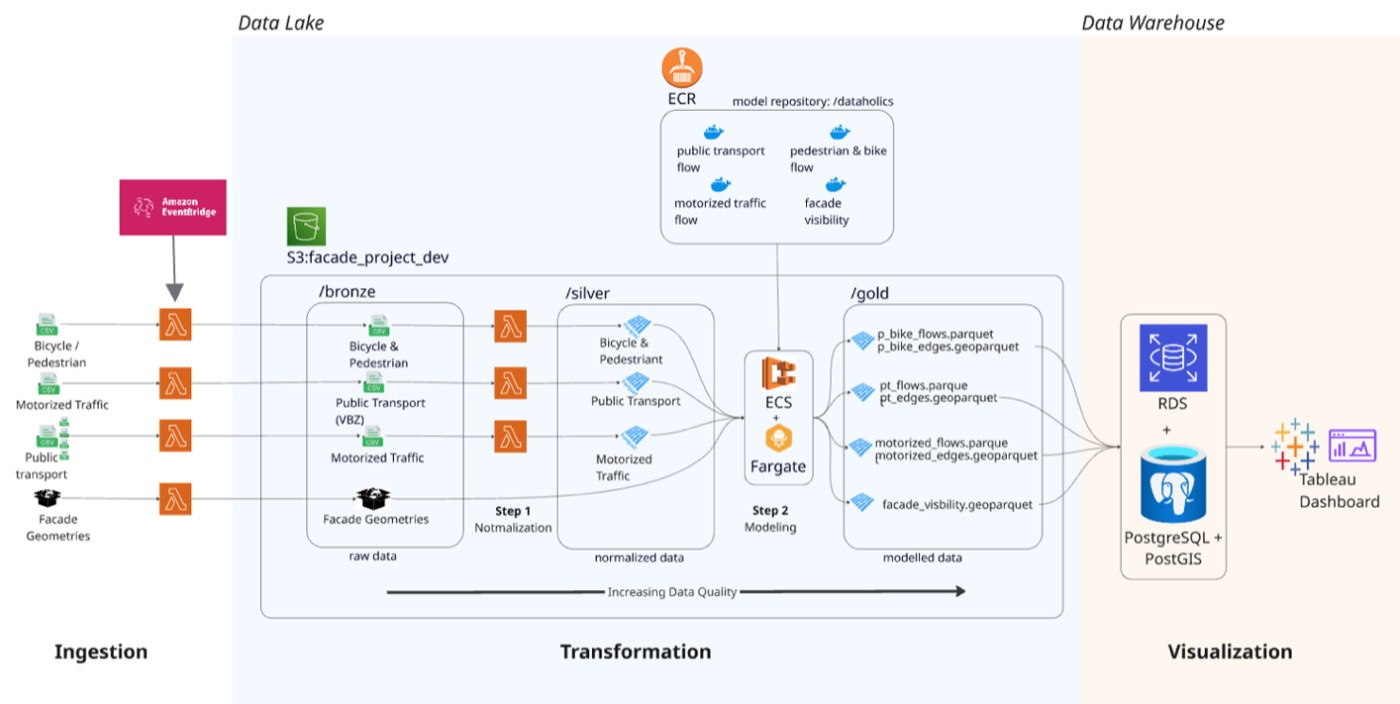
End-to-end architecture: Data Lake (Bronze / Silver / Gold), ECS Fargate modeling, PostGIS warehouse, Tableau visualization
Course project at HSLU with Marcel Amrein and Fadri Campell (Data Warehousing & Data Lake Engineering).
Overview
In Switzerland, outdoor advertising is dominated by a few established players like APG|SGA, who focus on premium, centrally managed locations — transport hubs, billboards, and high-traffic corridors. But the vast majority of building facades remain unassessed, even though many are exposed to significant pedestrian, cyclist, car, and public transport traffic.
FacADe addresses this gap with a data-driven platform that quantifies visibility for every building facade in Zurich. It serves two target groups:
- Marketing agencies and advertisers (demand side) — who need a reliable way to identify facade surfaces with high advertising potential, compare locations by exposure across mobility modes, and plan campaigns beyond the traditional premium inventory
- Real estate owners and portfolio managers (supply side) — who want to assess whether facade advertising represents a viable revenue stream for their properties, compare buildings within a portfolio, and evaluate expected returns transparently
Data Pipeline
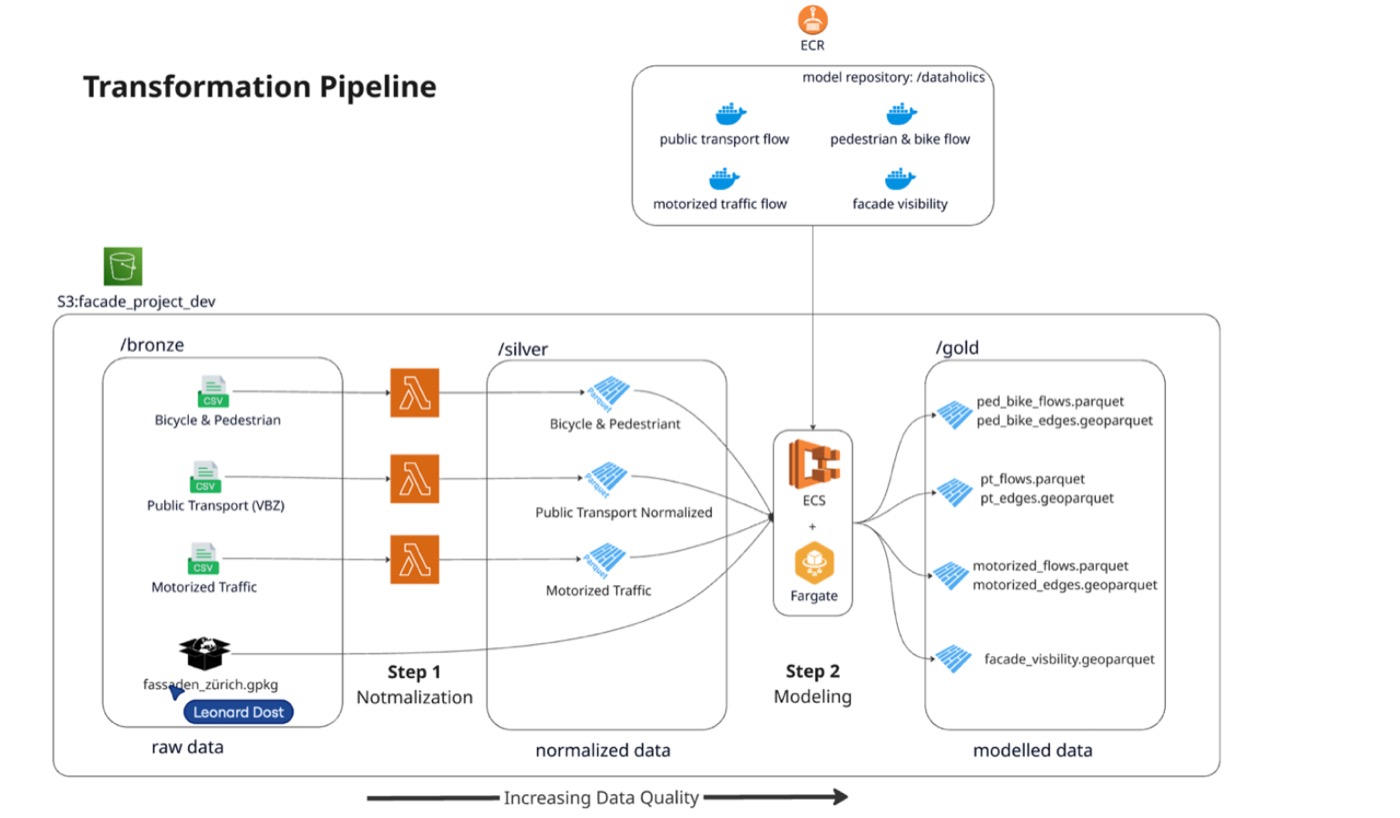
Transformation pipeline: Bronze (raw) → Silver (normalized) → Gold (modeled) via ECS Fargate
The system implements a medallion lakehouse pattern on AWS:
- Ingestion (Bronze): AWS Lambda functions fetch mobility data weekly from Zurich’s open data APIs — motorized traffic counts, VBZ passenger volumes, pedestrian and cyclist measurements, and building facade geometries
- Normalization (Silver): Raw files are standardized — column naming, timestamp formats, geometry fields, coordinate systems (EPSG:2056)
- Geospatial Modeling (Gold): Four independent models run as Docker containers on ECS Fargate, each producing spatially explicit flow estimates
- Warehouse (PostgreSQL/PostGIS): Gold layer outputs are loaded into a star-schema warehouse with spatial indexing, materialized views, and facade-level aggregation
- Visualization (Tableau): Two dashboards powered by the warehouse — one for marketing agencies, one for property owners
Geospatial Models
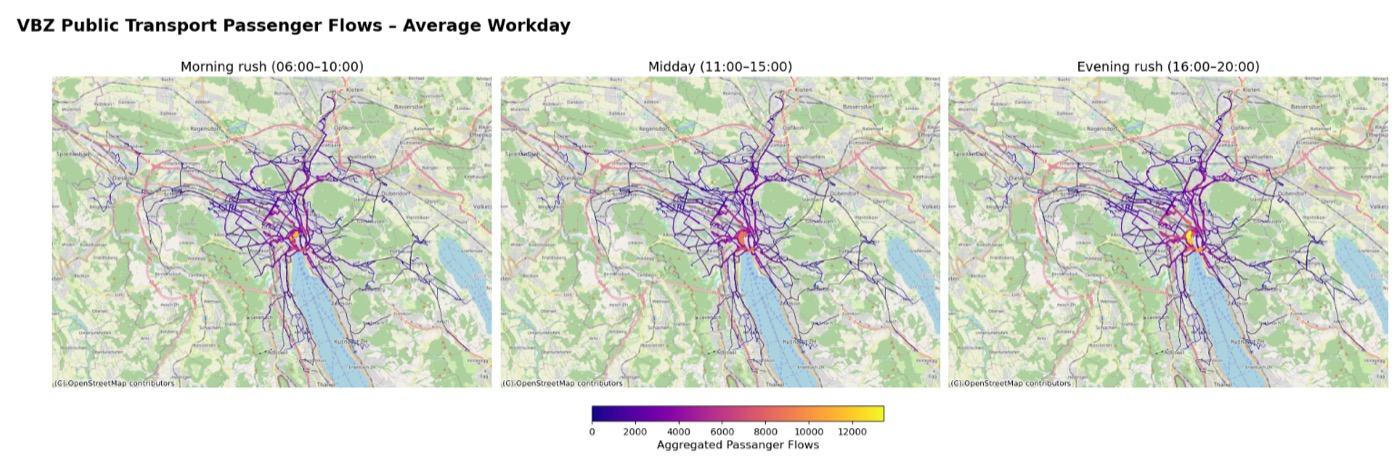
Public transport flows (morning / midday / evening)
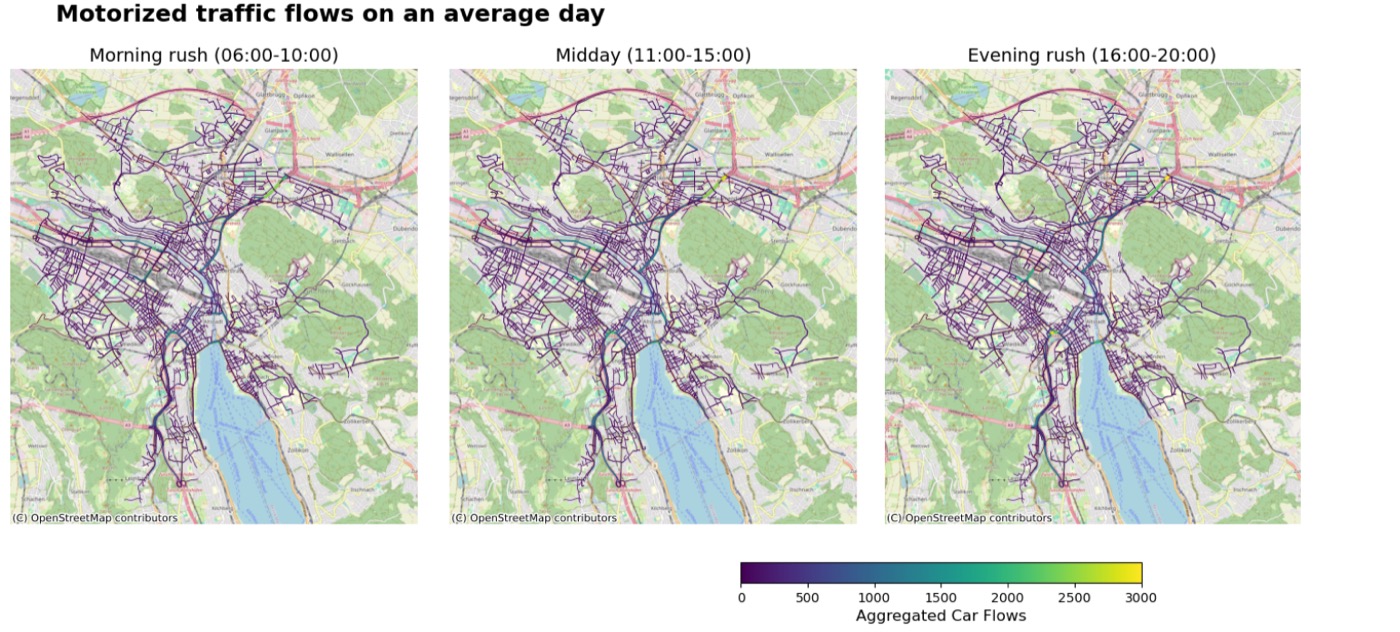
Motorized traffic flows (morning / midday / evening)
Four models produce the spatial flow data that feeds the warehouse:
- Facade Visibility Model — Computes sightline polygons per building facade (configurable distance and angular opening)
- Public Transport Model — Georeferenced VBZ passenger flows via GTFS matching and shortest-path routing on OpenStreetMap
- Motorized Traffic Model — Network propagation from counting stations with distance decay, directional weighting, and mass-balance safeguards
- Pedestrian & Bicycle Model — Flow distribution across separate walking and cycling networks with mode-specific travel distances
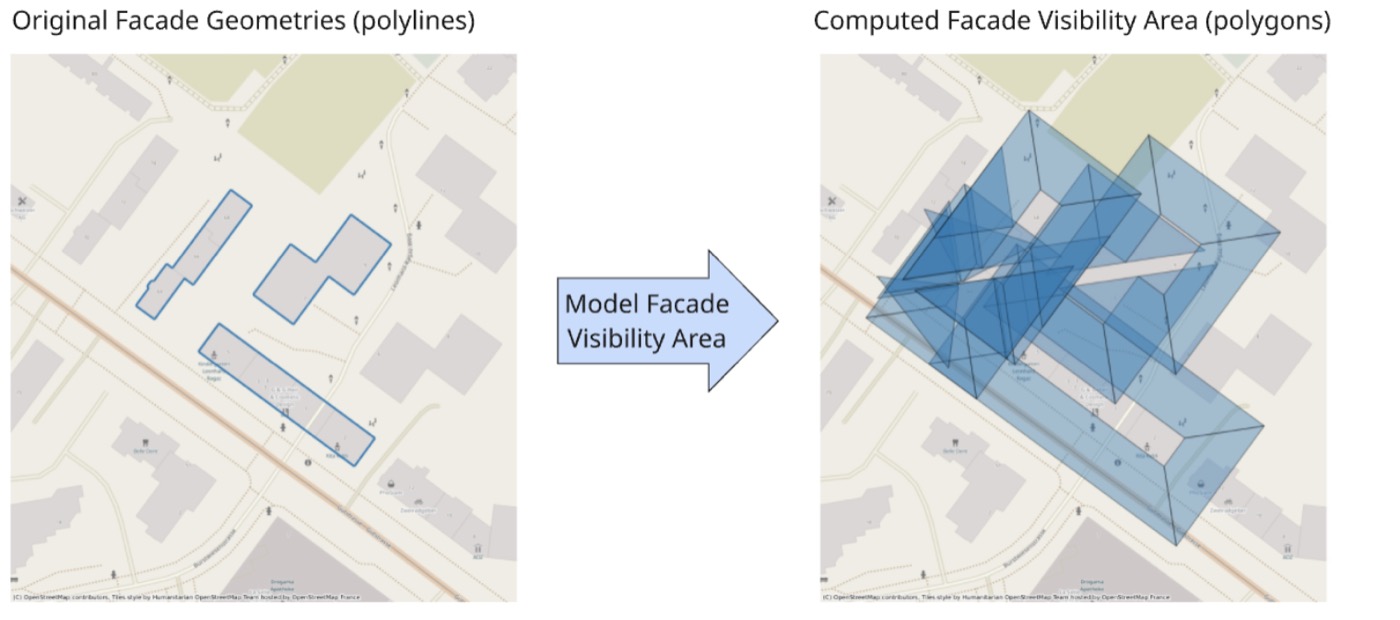
Facade visibility model: building geometries (left) transformed into sightline polygons (right)
Team Responsibilities
The project was divided by pipeline stage:
- Amrein led all ingestion and partitioning pipelines (Lambda functions, Bronze → Silver)
- Campell built all four geospatial transformation models (ECS Fargate containers)
- Dost (my scope) — the data warehouse layer and visualization:
- PostgreSQL/PostGIS database schema with spatial indexing (GIST) and materialized views
facade-warehouseingestion system for loading Gold-layer Parquet/GeoParquet into PostGISglue_loader_jdbc.pyfor reliable JDBC-based database loading- Google Streetview API integration for facade imagery in dashboards
- Both Tableau dashboards: Impressions Dashboard and Revenue Dashboard
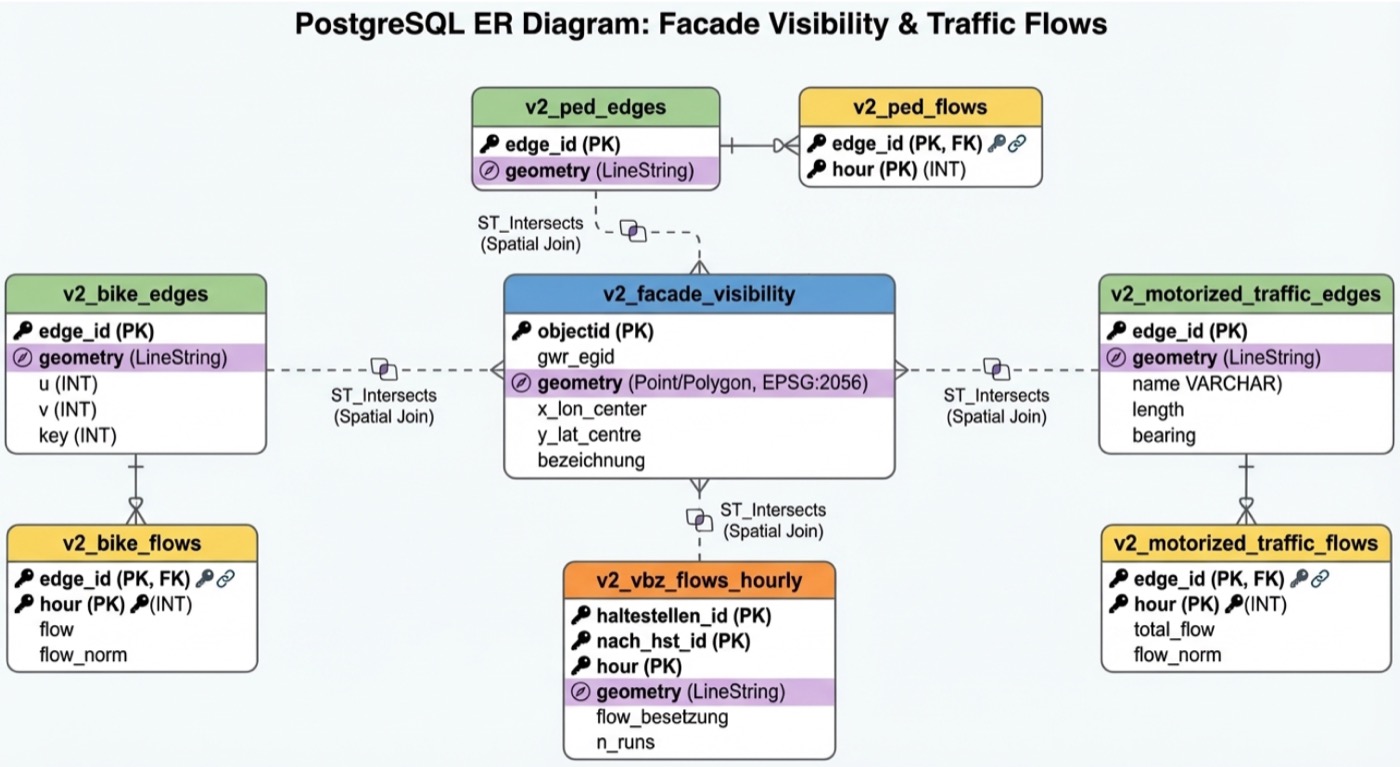
Warehouse ER diagram: facade visibility at center, linked to four mobility flow tables via spatial joins
Dashboards
Both dashboards follow a task-oriented, progressive disclosure design. The key interaction pattern: clicking any row in the facade ranking table immediately updates the map view and the embedded Google Streetview image. This allows a user to go from a quantitative ranking to a visual assessment of a specific facade — its orientation, surrounding streetscape, and potential obstructions — in a single click, without leaving the dashboard.
The hardest engineering challenge was connecting the tabular warehouse data with the spatial map and Streetview layers. Each facade needed to carry its centroid coordinates (for map positioning) and a pre-computed Streetview API URL (for the image embed), all derived from the PostGIS warehouse and served consistently across both dashboards.
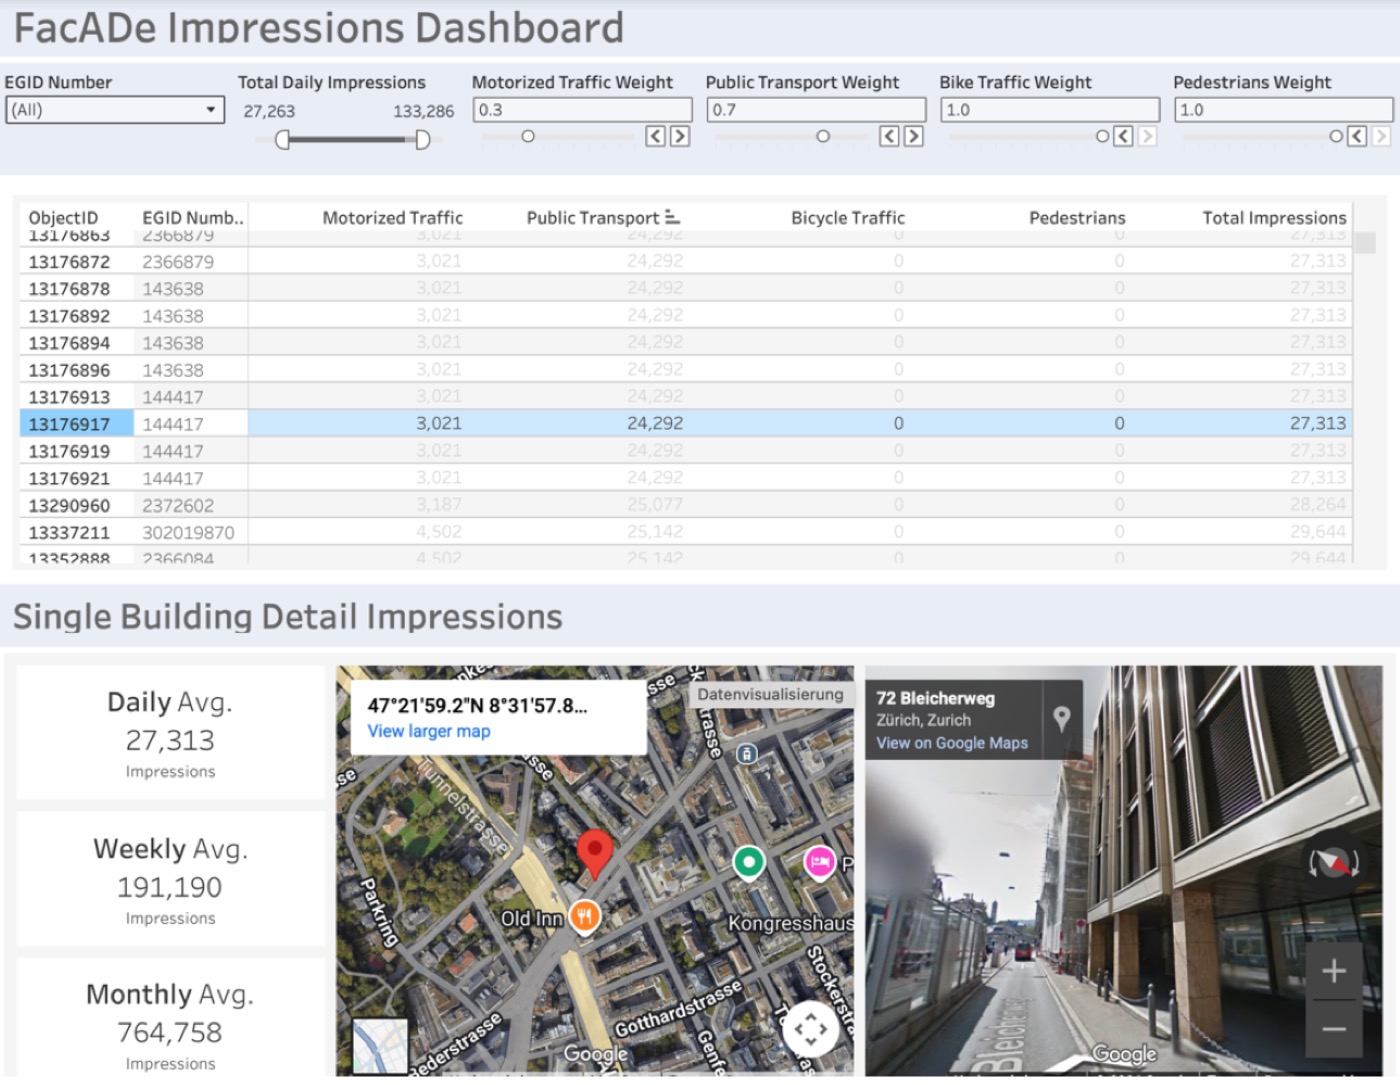
Impressions Dashboard: ranking facades by visibility, with mode-specific weighting sliders, map, and Streetview
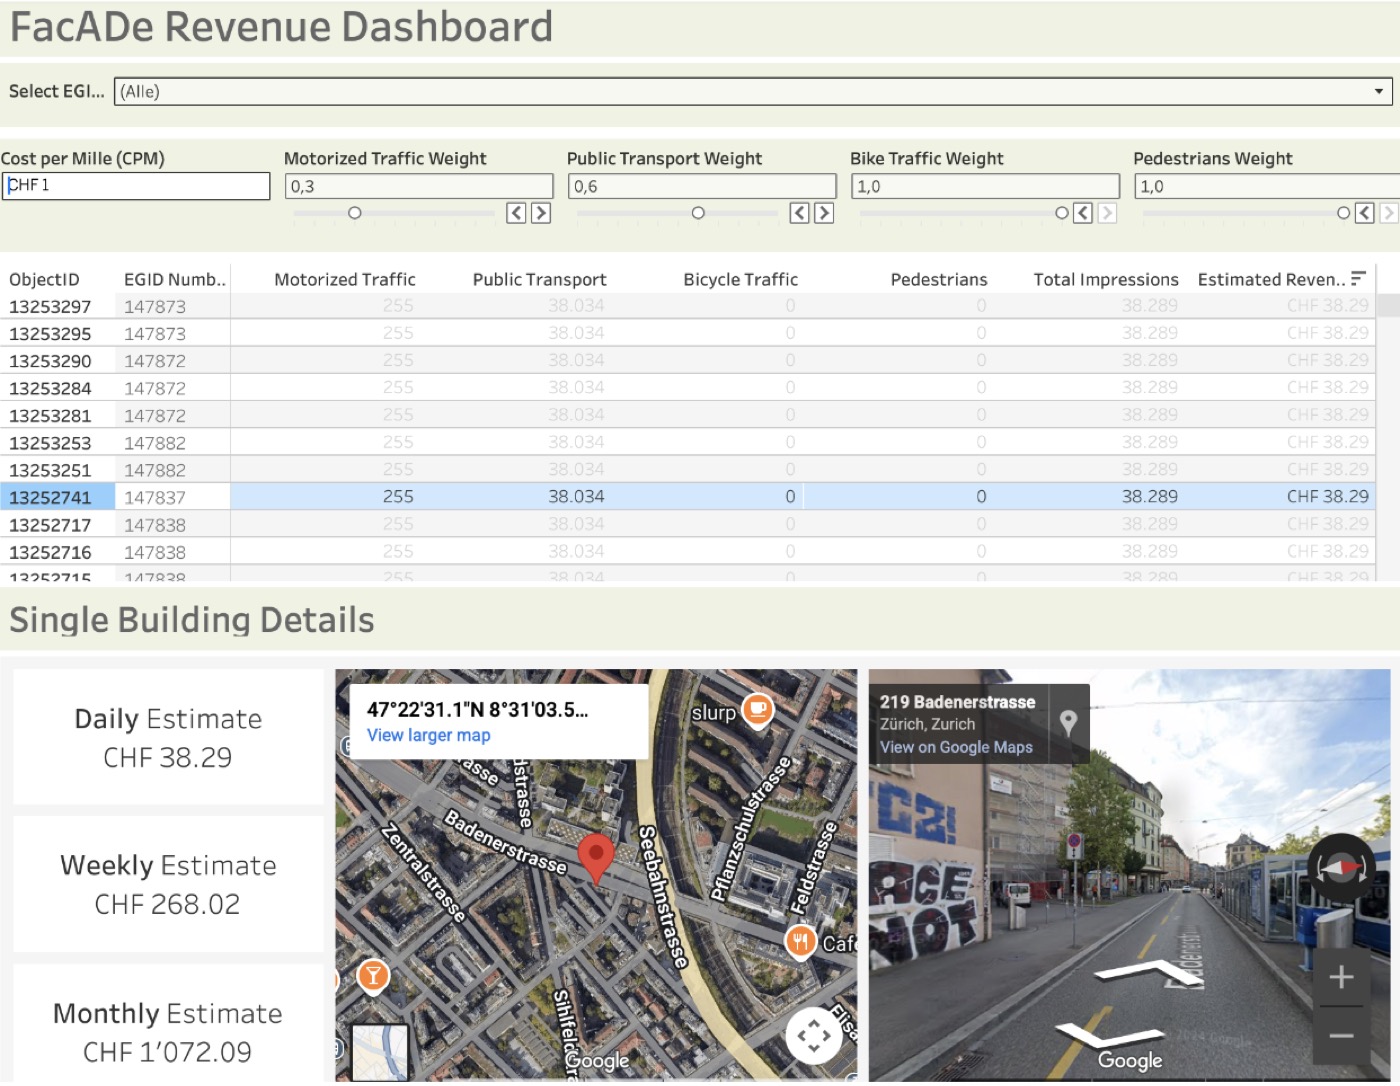
Revenue Dashboard: translating impressions into CHF estimates via configurable CPM, with same click-to-inspect interaction
Key Technical Decisions
- PostGIS over pure Parquet analytics: Spatial joins (facade polygons intersecting flow edges) are the core analytical operation. PostGIS supports these natively with GIST indexing, while a Parquet-based approach would require loading geometries into memory for every query. The trade-off: higher operational overhead, but interactive dashboard performance.
- ECS Fargate over Lambda for models: The geospatial models depend on low-level libraries (GDAL, Shapely) that exceed Lambda’s layer size limits. Fargate provides a Docker-based runtime with no size constraints.
- Star schema with materialized views: Dashboard queries aggregate impressions across four mobility modes per facade. Pre-computing these aggregations in materialized views reduced Tableau query time from minutes to seconds.
Key Outcomes
- Scored 415,977 building facades across Zurich with multi-modal visibility metrics
- Dashboards support configurable CPM pricing and mode-specific weighting — agencies can prioritize pedestrian vs. transit exposure depending on campaign goals
- Across all scored facades, total daily impressions exceed 133,000 from motorized and public transport alone
- Example output: a single facade on Bleicherweg received an estimated 27,313 daily impressions and CHF 38.29/day in indicative advertising revenue
What I Learned
Designing the warehouse layer taught me the importance of separating modeling logic from query logic. Early iterations had complex spatial joins executing inside the warehouse at query time, which made Tableau unusable. Moving those computations upstream into the Gold layer — and using the warehouse only for aggregation and serving — was the key architectural insight that made the system performant.
Beyond my own scope, the project gave me a solid understanding of traffic simulation and flow propagation. Learning how sparse counting-station measurements can be propagated across an entire street network — using distance decay, directional heuristics, and mass-balance constraints — was one of the most informative aspects of the project. It fundamentally changed how I think about working with spatially sparse sensor data.
On the data side, the biggest limitation was sparse pedestrian and cyclist sensor coverage. The City of Zurich operates far fewer pedestrian/bike counting stations compared to motorized traffic sensors. Since pedestrian exposure is often the most valuable form of advertising visibility, this directly limits the platform’s business value. In a production setting, this could be addressed through synthetic mobility data (e.g., Meta’s Data for Good population movement datasets), inference from nearby sensor clusters, or integration of mobile phone location signals to fill coverage gaps.
Technology Stack
- Cloud: AWS Lambda, S3, ECS Fargate, Step Functions, EventBridge, ECR
- Database: PostgreSQL 12+ with PostGIS, GIST spatial indexing, materialized views
- Geospatial: GeoPandas, NetworkX, OSMnx, Shapely, GDAL
- Visualization: Tableau Public (extract from PostGIS)
- Languages: Python, SQL, Bash